
The Little League World Series (LLWS) is once again upon us. I love watching these young athletes play this game in its purest form.
The coaches in this year’s LLWS are mic’d up to give us some more insight into the game. We don’t hear them all the time but if we did, I’d bet we would hear this phrase a couple of times from the dugout directed to the pitcher:
“Use your legs!!!”
Everyone knows that you have to use your legs to effectively throw a baseball. If you want to keep your elbow and shoulder as healthy as possible, you need to use your legs.
If you want to throw as hard as possible, you definitely need to use your legs.


While everyone knows they need to use their legs, not everyone knows HOW to use their legs. The problem is that many coaches themselves don’t really know the exact answer either.
One reason is because not much is really known about the lower half as compared to the upper body in the research world.
Even the question of “how do I use my legs?” is pretty vague and broad. We really need to break it down into more precise questions like:
- How much force do I need to produce with my legs?
- When do I need to try and produce force with my legs?
- Where should I be directing the force with my legs?
These questions are really hard to answer since we don’t receive objective and quantifiable information about our legs and how they interact with the ground when we throw a baseball.
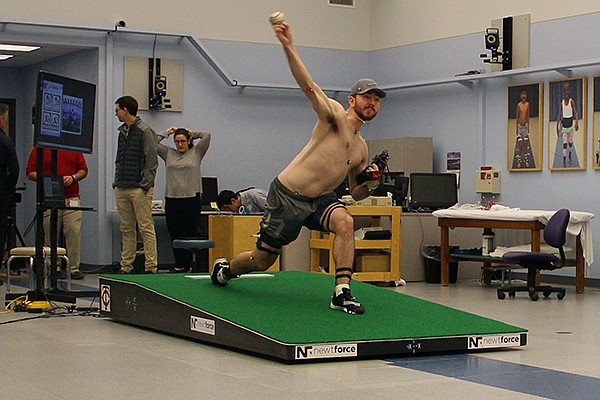
Very few of us are working with mounds equipped with force plates to give us the answers to these kinds of questions. So, we have to rely on information from those that do and pass on what they have learned.
Today I wanted to share my breakdown of a study that I came across from a couple of Universities (Marquette and Saint Louis) that I think provides some answers to the questions I mentioned above and thus needs to reach as many baseball players and coaches as possible. The best part is that they used Little Leaguers (age 11-13) as their subjects.
Peak horizontal ground reaction forces and impulse correlate with segmental energy flow in youth baseball pitchers
The title of this study is not going to jump out to most people due to the jargon. The terms like impulse, energy flow and ground reaction forces aren’t that common in baseball circles so let’s start by quickly defining them.
Ground Reaction Force (GRF) is a measurement of how much force you put into the ground.
The easiest way to experience GRF is to go stand on a weight scale, preferably an older style with the dial.
Once you’re on the scale press down with your feet as if you are about to jump – you should see the dial quickly go past your body weight.
This happens because you’re putting more force into the ground.
Those people who can jump high are really good at putting a lot of force into the ground, and since the ground isn’t going anywhere it forces your body up off the ground.
This is the “reaction” part of the name.
Obviously, these Universities aren’t just getting pitchers to stand on bathroom scales while they pitch.
They use expensive Force plates which are essentially really fancy weight scales that can tell you how much you are applying, when you are applying it and in which direction.
Peak GRF is the most common piece of information that we traditionally get from studies. This lets us know what was the highest amount of force that was produced during a movement.
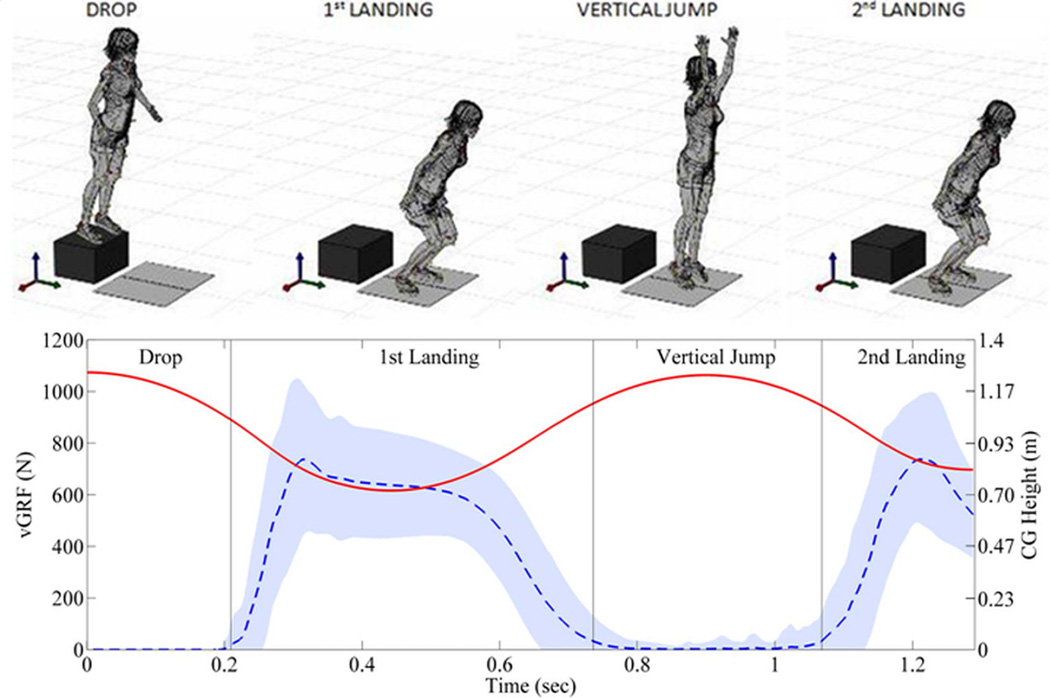
If we were to look at the vertical jump again, we see that we aren’t producing the same amount of force throughout the entire action. There is a build-up of power. To find the peak, we simply look for the highest point.
Impulse GRF is another type of measurement that we get from force plates, looking at how much force was applied over a specific time period.
Force plates can provide us with this kind of information since they are taking snapshots of how much force is being applied every millisecond.
Energy Flow is a term that I wasn’t familiar with until recently, but I’ve been seeing it more as an outcome measure. What I mean by this is that studies are using Energy Flow like they would velocity in other throwing studies. So, studies would look to see if something increased or decreased Energy Flow.
Based on the definition below, Energy Flow is a good thing so we want to find things that improve it.
“Energy flow (EF) analysis is a method that allows researchers to quantify the transfer of mechanical energy between body segments, and thus provides some insight into the mechanics and efficiency of the body’s ‘‘kinetic chain”“
(Martin et al. 2014)
How they calculate energy flow is fairly complicated and is worthy of its own article.
For now, just know that they use some intricate math to create an equation using measures like segmental angular velocity, joint force power, linear joint velocity, and joint moment to come up with the final Energy Flow outcome.
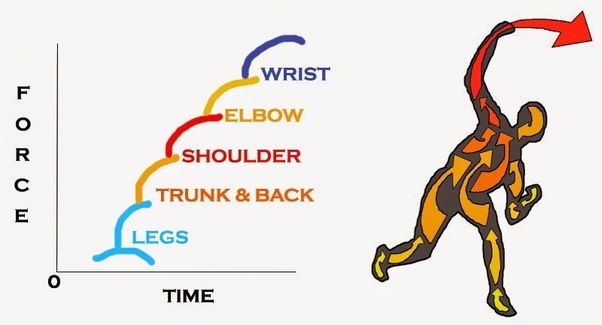
In this study, Energy Flow was measured at the pelvis, trunk, and throwing arm. In previous studies, Energy Flow at the shoulder joint had the highest correlation to throwing velocity.

Now that this is out of the way, let’s dig into the study.
The question that these researchers wanted to answer is to see which type of GRF, peak or impulse, was a better predictor of Energy Flow.
The quick answer is impulse.
We just learned that Impulse is how much force is applied over a specific period of time.
The specific periods of time in this study were:
- Drive Leg: peak knee height to front foot contact
- Stride Leg: front foot contact to ball release
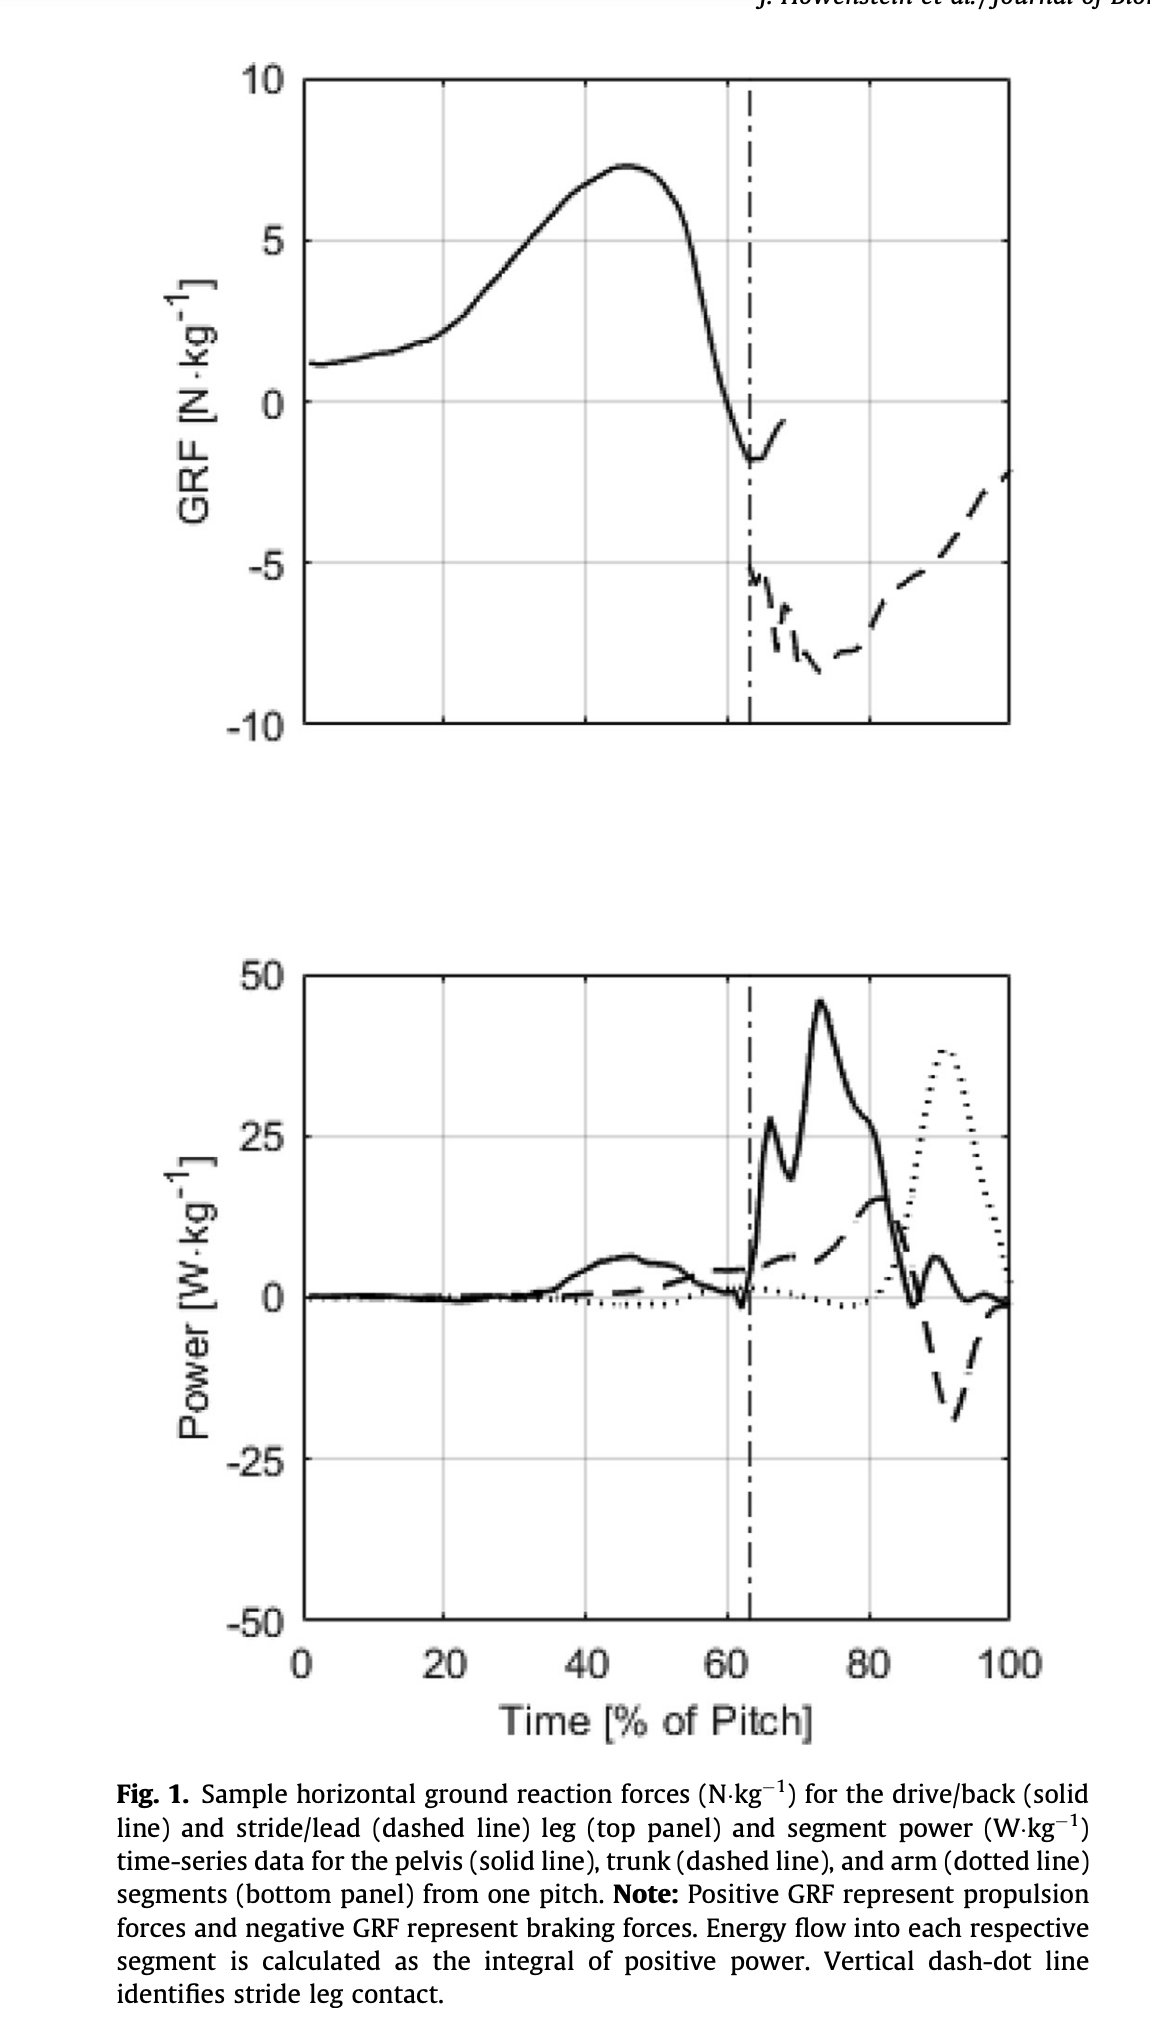
Peak GRF correlated with Energy Flow across the trunk and pelvis whereas Impulse GRF correlated with all three (pelvis, trunk, and arm).
The fact that Impulse was superior to Peak shouldn’t surprise us that much once we know their definitions.
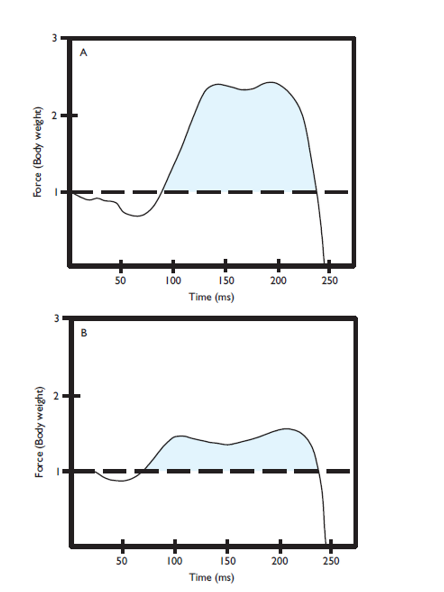
There’s some research that impulse GRF does a better job of predicting other dynamic movements like jumping compared to Peak GRF. (McBride et al. 2010).
Since these types of actions are executed over short periods of time the Peak doesn’t play as much of a role since athletes don’t have the time to display their highest level of GRF.
To truly reach your highest Peak muscle contraction we need more time.
This is why true strength tests like squats and deadlifts take a second or two to complete.
In exercise science labs they will often use isometric contractions where you get 3 seconds or more to ramp up the amount of force you can produce.
The time period between peak knee height and front foot contact isn’t that long and as a result it seems that the amount of force produced during this time period is more important than just one hard push.
At Tread, we’ve spent a lot of time talking about how intent is important but the timing and sequencing of that intent may be even more important.
Too often when someone is told that they need to “use their legs more” it usually results in them pushing into the ground too hard, too early, and with the wrong muscle sequence.
This type of result, pushing harder = lower velocity, was reported in one of the first studies that I ever came across that used a force plate embedded into a mound (MacWilliams).
They reported a positive correlation between force being put into the ground and hand speed/ball velocity.
However, they reported on several occasions that some of the highest peak forces resulted in reduced hand speed/ball velocity.
On several occasions…some of the highest peak forces resulted in reduced hand speed/ball velocity.
What happens might be that too much force was produced too soon and couldn’t be integrated into the rest of the delivery and/or the stride leg didn’t have enough strength to accept and re-direct this force resulting in a slower throw.
We’ve all seen athletes that leap off the rubber with a forceful jump, but they aren’t able to capture any of that force into useable, rotational energy that can find its way into the arm.
That brings us to the results of the stride leg.
Peak GRF had a connection with the trunk and throwing arm while impulse GRF again was correlated with all three Energy Flow measures.
There was one occasion when Peak GRF outperformed Impulse and that was in the case of the stride leg amount of Energy Flow through the throwing arm.
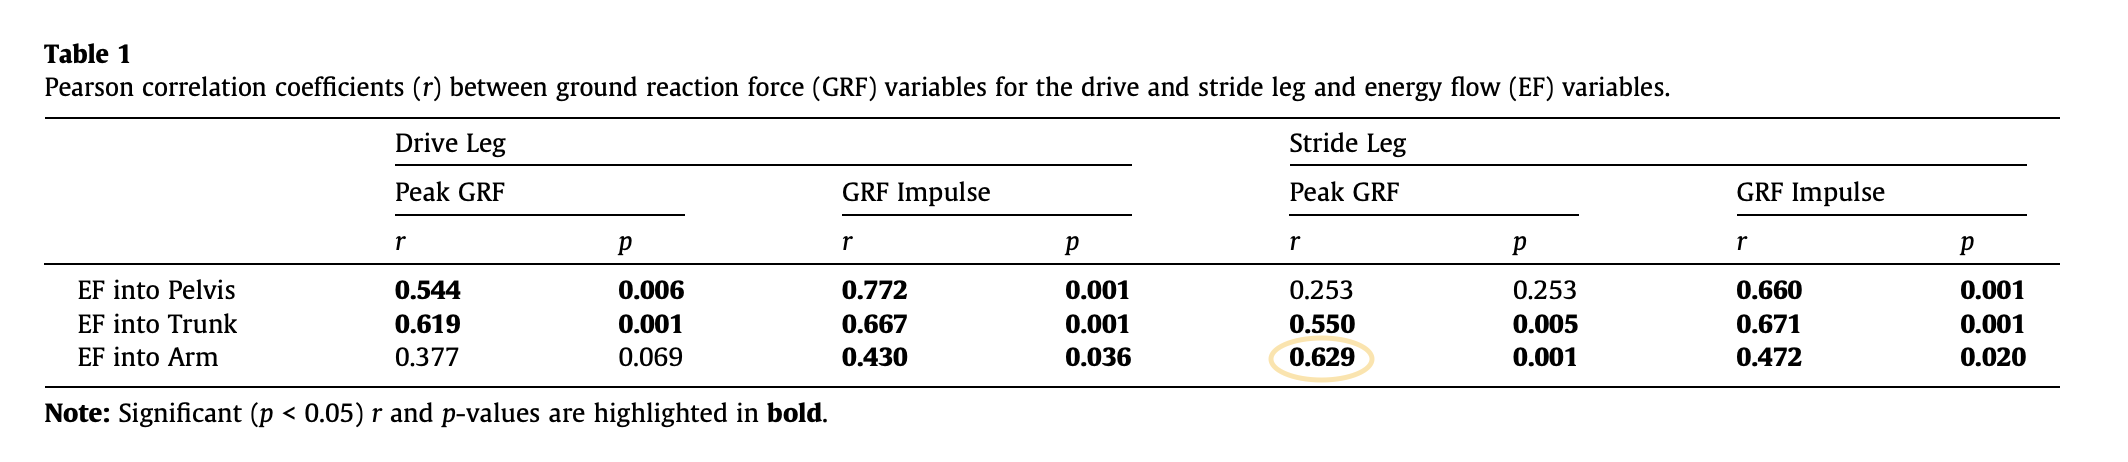
This is important because as we covered earlier when I was defining Energy Flow, this particular measure had the highest correlation with ball velocity.
Peak GRF of the front leg has been associated with ball velocity in other studies. (McNally et al) found that the peak vertical GRF forces were essentially the rate-limiting factor when they tested some recreational adult pitchers.
The difference other than the age of the subjects was that in the current study they looked at horizontal forces. These findings are great since they give us some insight as to where the force from the front leg needs to be directed, both back and up in a short amount of time.
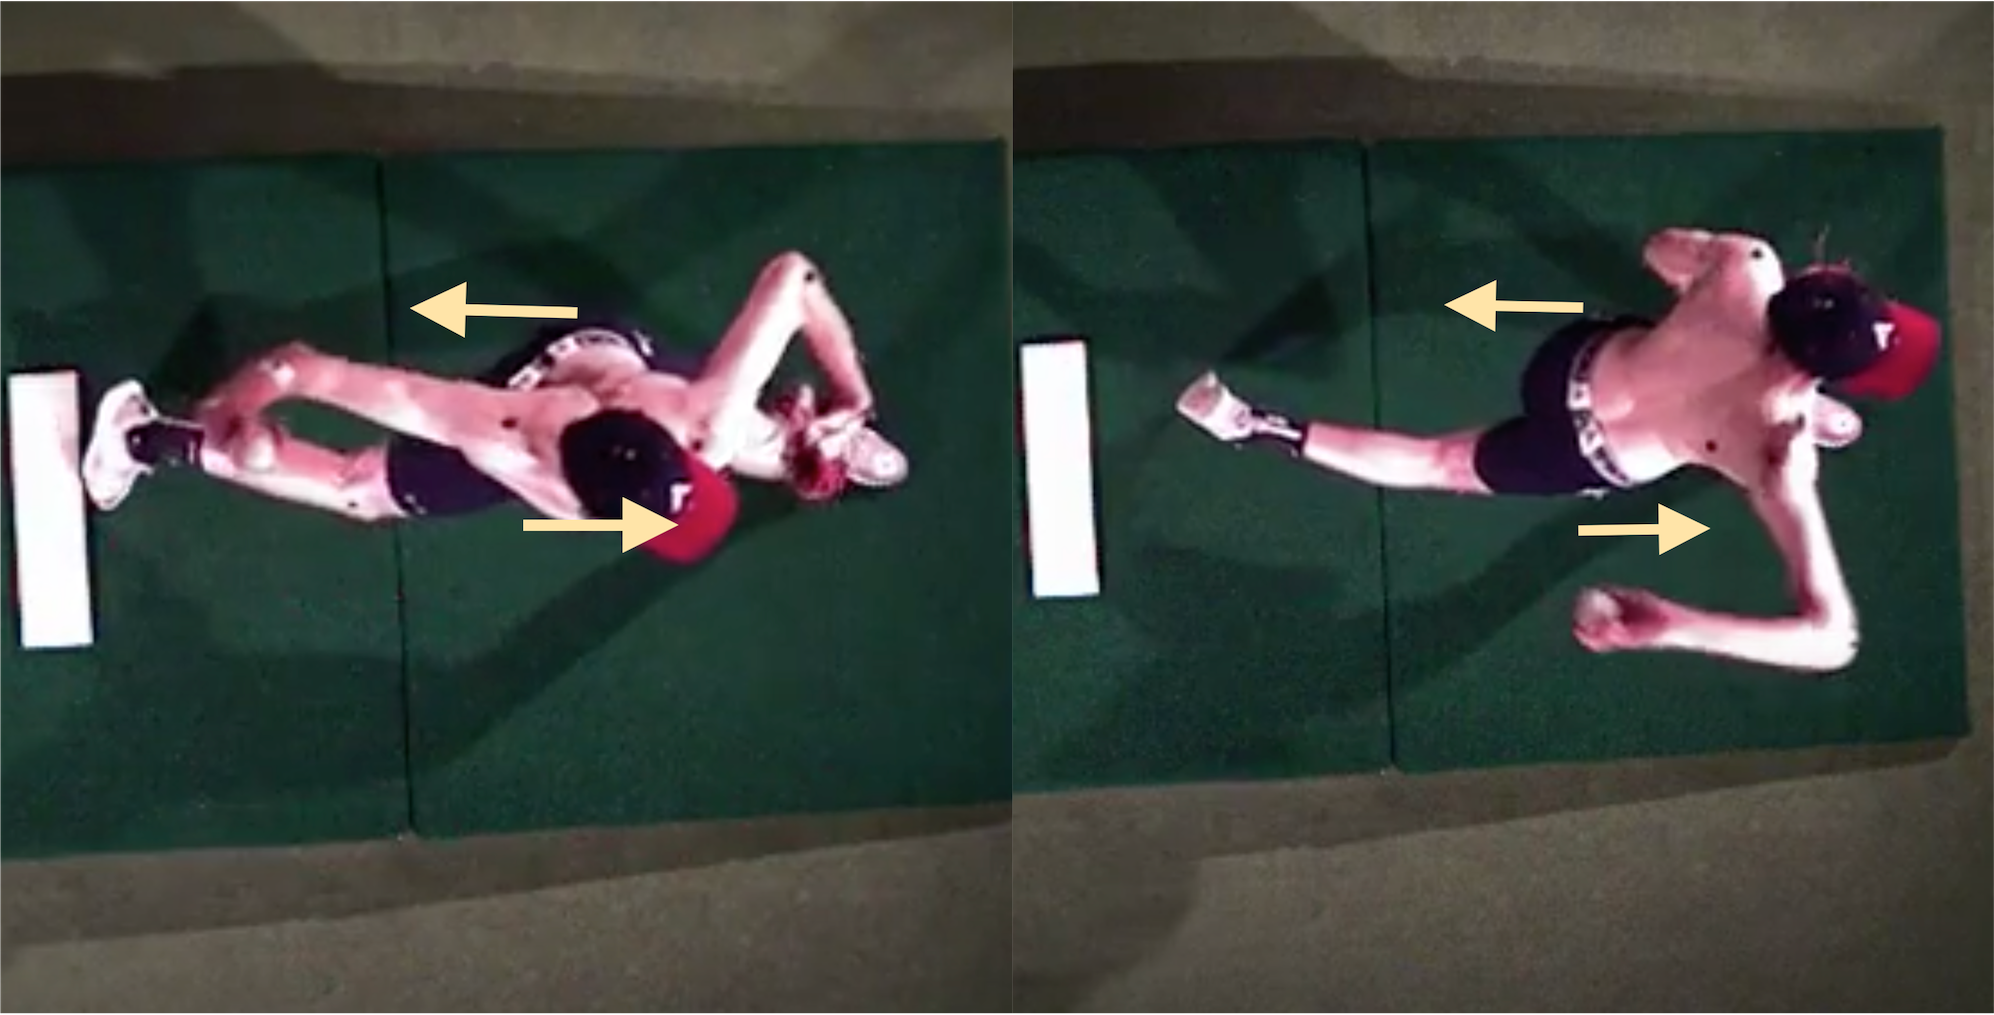
The authors went even further in their discussion of the results with this great statement that the actions of the front leg may:
“Allow the lateral aspect of the pelvis of the back leg the chance to rotate prior to the trunk.”
This sheds light on the fact that the front leg action isn’t simply a “car crash” reaction.
This is something that Ben has said over and over in various videos, but the fact that it’s being mentioned in a peer-reviewed research article should give it more authority.
The “car crash” statement really only tells us that the front leg has to brake in the sagittal plane, front to back. Previous research has shown that front leg action at the knee requires to go from a flexed to a more extended position during the time that the front foot hits to when the ball is released.
The problem is that it doesn’t take the rotational component of the front leg into account.
This statement about the “lateral aspect of the pelvis” highlights that in order for the lateral/outside aspect of the back leg to rotate around means that the lateral/outside aspect of the front leg has to rotate backwards.
This gives us more of a 3D idea of what’s happening.
In the sagittal plane, the front leg is extending while in the transverse plane the hips need to rotate. In terms of the frontal plane (side-to-side), we don’t want to see much action at all.
If we do some movement in the frontal plane, it will often be labelled as an “energy leak” which is obviously not a good thing when we are trying to optimize Energy Flow.
Summary
In summary we need a lot of force production from the lower half, but all force is not created equal if the timing/sequencing is off.
The back leg doesn’t get a chance to display its full strength since we are starting from a complete standstill.
This data suggests that for the drive (rear) leg, having a gradual build-up of force that can be effectively translated into the rest of the delivery may be more effective than one giant jump or push off the rubber.

It’s similar to quote about financial income “it’s not how much you make it’s how much you keep.” Just watch ESPN’s 30 for 30 documentary called “Broke” to understand what I mean.
For the stride (lead) leg, we need that leg to provide us with some force quickly. Luckily this can happen in a timelier manner since it’s a reactionary type of movement that relies on the stretch shortening cycle (SSC).
However, this still requires a base line of strength in order to take advantage of the elastic properties of the lead leg. This is similar to a “springy” athlete trying to do too high of a drop jump when they don’t have the strength to display their springs.
One of Tread’s objectives in the coming year is to build a pitching mound with an embedded multi-directional force plate. This will provide our in-house athletes an extra layer of valuable feedback on top of slow motion video and advanced pitch metrics from Rapsodo and Trackman.
Knowing vital pieces of information in regards to the lower body force like when, how much, and where will be another step towards both optimizing mechanics and performance.
Athletes or coaches interested in remote one-on-one or team programming? Reach out via this application form.