

By Graeme Lehman, MS
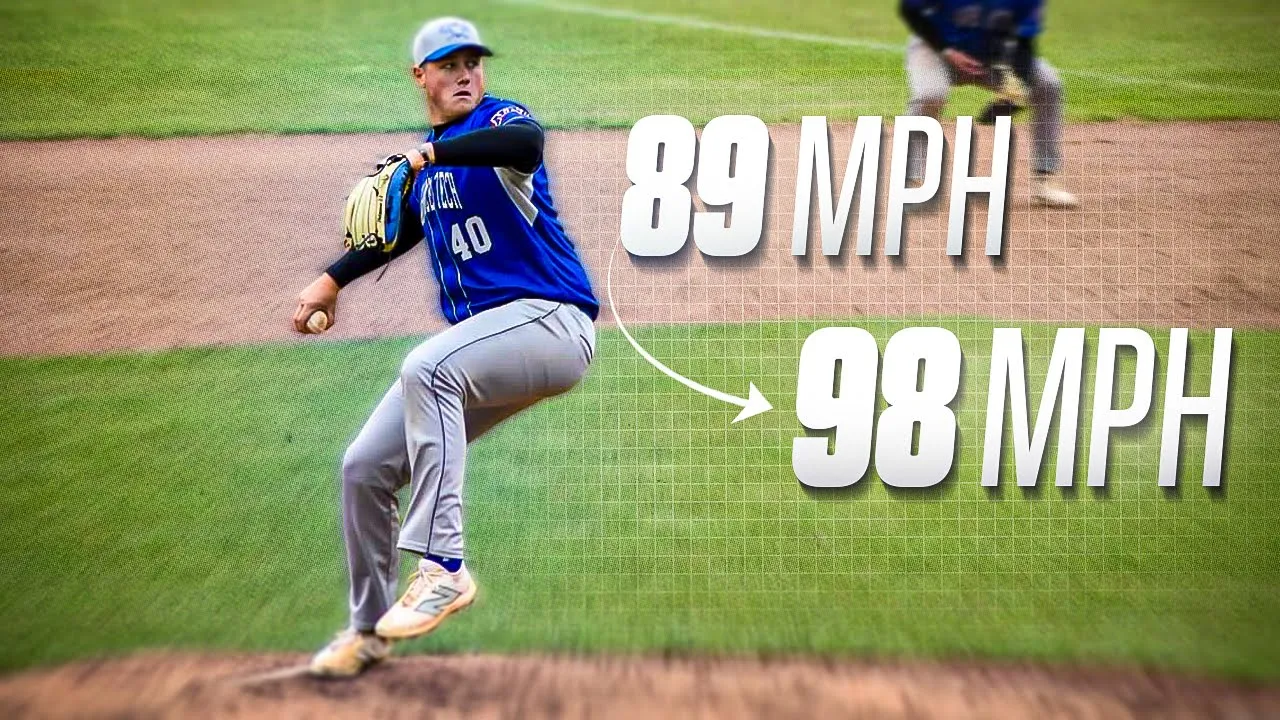
Before spring training was brought to a halt, one of the biggest stories was just how dominating Nate Pearson of the Toronto Blue Jays was during his outings. In his first six innings, he faced the minimum and struck out 15 over 3 appearances. Now, spring training stats are nothing to get excited about but his “stuff” is definitely worth getting excited about. Namely, his triple-digit fastball making him one of the hardest throwers on the face of the earth.

At Tread, we love analyzing the fastest throwers in the game so that we can continue to gain more insight as to what the best in the business do so that we can learn and then pass this information along. And that’s exactly what we are going to do here with Nate Pearson.
What’s going to really make this article really interesting is that we have some in-depth knowledge in form of some physical testing and measurements that will shed some light on exactly how he and his body creates this elite level of velocity.
Where did I get this information?
In the 2017-18 NJACC season, when Nate won the Rawlings Golden Spikes award, I was a remote strength coach with his team, the College of Central Florida Patriots led by coach Marty Smith.
:format(jpeg)/cdn.vox-cdn.com/uploads/chorus_image/image/56011107/Pearson.0.0.jpg)
As part of my initial assessment we had the whole team run through an extensive set of tests so that I could gather as much information as I could before writing up a training program. Being a remote coach, this step is vital. The more information I could get the better – this something that is a cornerstone for how we assess and program for our remote athletes here at Tread.

It should be noted that during that time he was (only) topping out at 94 mph. So, it is really only a snap shot in time but I think it’s still valuable information.
It was an amazing to see his progression happen so quickly where he was touching 100 mph in late November to throwing 102 mph in front of scouts prior to the draft. By no means am I trying to say that it was me and my training program that led to these results. The biggest factors were Nate’s hard work and the coaching staff at the College of Central Florida, most notably their pitching coach Zach Bove who is now with the Minnesota Twins.
Since the guys at Central Florida were so on board I was able to get any information I wanted which allowed me to get a more comprehensive look at each athlete.
To assess athletic ability, I had them run a series of tests that included various types of sprints, jumps and med ball throws. To get an idea behind why I choose these particular tests check out this article I wrote a while back title “MLB Combine”.
Let’s take a look at how Nate performed starting with the jump.
Vertical Jumping
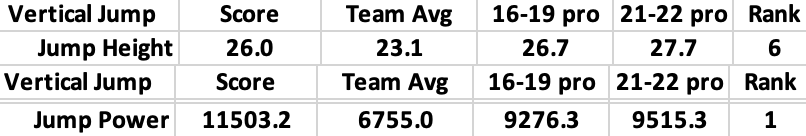
When we look at the vertical jump we see that Nate’s scores are good but they don’t jump off the page.
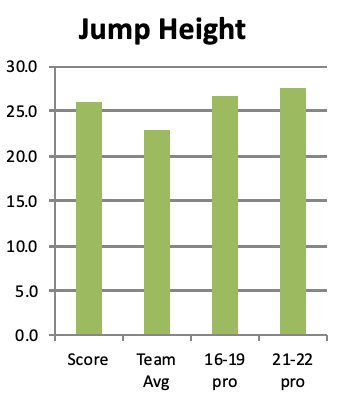
His 26.3” score put him 6th best on the team and below the reported scores from professional players that were published in 2002. That’s not bad for a guy his size. But it’s when you take into consideration his size that you see him outperform his team and these professional players. This power formula has a way to factor in body weight in order to see how much power an athlete produces when they jump. So, in order for Nate to get his 245 lbs off the ground by 26.3” he had to produce 11503 Watts of power.
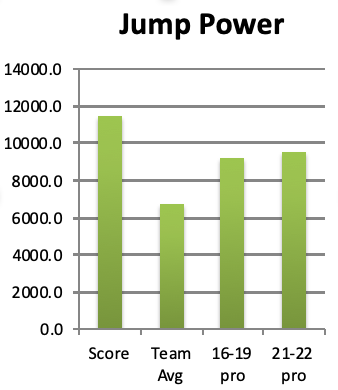
This chart shows just how much more power he produces.
Broad Jump
This is another simple test that gives you an idea of an athlete’s ability to produce power. His 9’2” jump placed him near the top of the team but again we take power into consideration he’s way ahead.
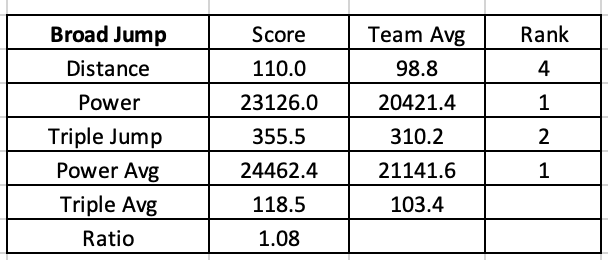
The triple jump you see is just three consecutive broad jumps with no stopping between jumps. You SHOULD be able to jump further because of a larger stretch reflex cycle but you first need the strength to decelerate between jumps so that your tendons can apply the extra force.
The fact that Nate does have a positive ratio between his triple jump average (118.5”) and his broad jump (110”) means that has adequate level of strength in his legs and elasticity in his tendons. Both good things.
As a note, I used the same formula here for the broad jump that I did with the vertical jump. I know that this isn’t good science but at the time I did not know of a broad jump power formula. In my quest for more knowledge I came across this one that Dr. Bryan Mann helped produce.
Long Jump (peak power) = -2722 + 43.03 * Body Weight (kg) + 1423 * Jump Distance (meters)
Using this new and improved formula Nate produces 6491 Watts of power while the team averaged 4881 W.
Lateral Jump
This is the jump that has the highest correlation to throwing velocity due to its specificity to the act of throwing. We see the same trend here. Nate scores relatively well in the top 25% but when body weight is added to the equation he soars to the top…by a lot.
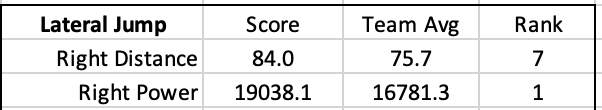
Again, I used the vertical jump formula but even when I use the broad jump formula which is made for horizontal jumps, like the lateral jump, the results are the same. Nate punches out 5963 W whereas the team average was 4016 W.
Sprinting
Pitchers are very rarely going to be the guys that have the fastest times when the old stop watch gets broken out for timing the 60 Yard-Dash. This was the case here again but Nate did have the 8th best time on the team which speaks to his overall athletic ability. For him to get that big frame and 245 lbs of body weight to cover that distance in 7.12 seconds is pretty impressive.
While that is pretty fast the really impressive part is again when you factor in body weight. If you were standing in his way at the finish line you would be on the receiving end of 3345 Joules. What’s a Joule you ask? Its unit of energy that can be determined using a simple formula where you take an object, in this case the object is Nate Pearson, and divide its mass in half and then multiply that by his speed squared. Sorry if I lost there with that math talk.
Here’s the formula written out – you might even recognize from a high school physics lesson.

To put that in perspective, an athlete who weighs 180 lbs would have to run a 6.1 in order to produce the same amount of power.
In addition to the traditional 60 yard-dash, I also had the guys at Central Florida run 10 yard-dash’s and pro-agilities (5-10-5).
These were selected as tests because they give a better representation of the kind of running that actually happens in the game of baseball which places more of an emphasis on acceleration and change-of-direction. Plus, there is some published research out there on these specific tests using pro-baseball players.
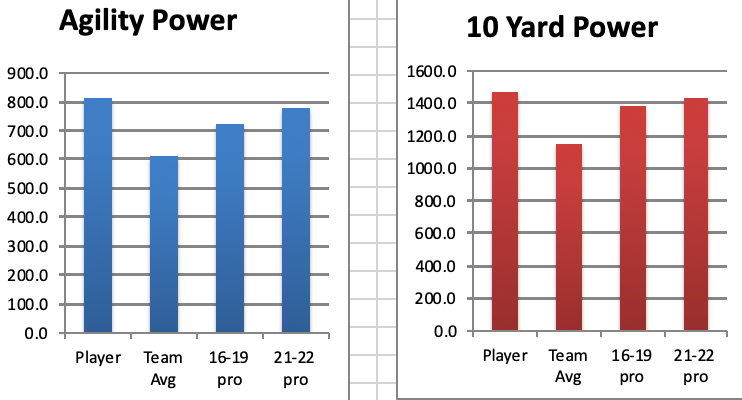
Here’s how he did compared to both his teammates and the data that I just mentioned with the pro-players (keep in mind when you look at this bar chart that a shorter bar means a faster/lower time).
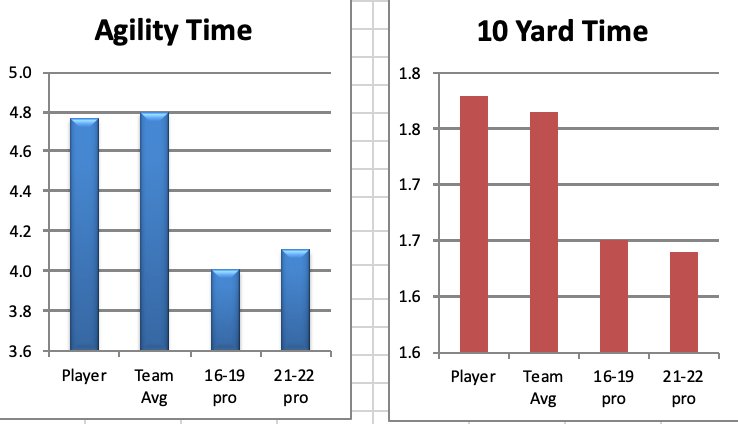
Nate’s 10 Yard Dash of 1.78 seconds was his lowest ranking. He was 21st on his team out of 35 players. His pro-agility time of 4.8 seconds placed him 14th. But, again, when you factor in body weight the results show just how powerful of an athlete we are dealing with here as he shot to the top for each one.
Medicine Ball Throws
Throwing a med ball around is fun, not to mention that it can have a beneficial training effect, and has been shown to predict throwing velocity.
Nate was #1 for the backwards throw and #4 for the forwards med ball throws. The backwards toss, for the record, is a better predictor of throwing velocity out of the two.
His dominance here makes sense since it is a power assessment. His high body weight and longer limbs are advantages in this test. He was able to launch a 6 lbs ball 73.5 ft behind him. That’s far!!! Go ahead and try this one yourself to see just how powerful that really is. The team average was 56.6 ft.

The forward toss team average was 43 ft and Nate scored 49 ft.

Conclusion
The main take away here is that power matters….a lot!!
The addition of body weight into some pre-existing formulas does a really nice job of showing us what kind of power an athlete can produce. Nate is a powerful athlete and that is huge contributor to his evolution from gangly college pitcher to one of the world’s hardest throwers.
Stay tuned for part 2 next week where we will be breaking down Nate’s throwing mechanics to help complete the puzzle regarding his elite velocity.